Exposed Admin Panels: How Attackers Find Your Jenkins, Grafana, Kibana and phpMyAdmin
By Mohana SubiPublished
In July 2024, a ransomware crew got into an Indian banking technology supplier through one internet-facing Jenkins server. The fallout stopped ATM and UPI payments at hundreds of small banks. The attackers didn't need a zero-day. They needed a login page that should never have been public, running a version that should have been patched months earlier.
An exposed admin panel is any management interface that answers requests from anyone on the internet, when it should only answer trusted networks or identities. Jenkins, Grafana, Kibana and phpMyAdmin are the four that show up most often in real incidents. Each one holds something an attacker wants: build credentials, data source passwords, raw log data or a direct line to the database. Internet-wide scan databases revisit public IP space constantly, so a new panel does not stay unlisted for long. Assume an attacker can find yours. What you control is how long it stays findable, and what it gives away in that time.
This guide covers how attackers locate these panels, what each one gives away, the 2026 vulnerabilities that make them worse, and a practical method to find and close your own.
What counts as an exposed admin panel?
An exposed admin panel is an administrative interface, management console or privileged login page that responds to arbitrary internet hosts instead of only trusted networks or identities. That covers application back ends, database front ends, infrastructure consoles and internal tools that someone built for a team and never meant to publish.
Exposure has two levels, and the difference sets your priorities.
- Open without authentication. The panel loads and works for anyone. This is an active incident, not a finding to schedule.
- Exposed but authenticated. The login page is public. The attacker now needs a password, a stolen session, a default credential or a pre-authentication bug. Each of those happens often enough that a public login page is never "fine".
DevOps and observability tools dominate real incidents because engineers stand them up quickly. They often run on cloud instances with public IPs, and they connect to everything else. A dashboard that reads from production databases is also a dashboard that stores credentials for production databases.
How do attackers find exposed admin panels?
Attackers rarely scan your network first. They search databases that have already scanned the whole internet. MITRE ATT&CK tracks this as Search Open Technical Databases (T1596), with scan databases such as Shodan, Censys and FOFA listed under T1596.005. These engines record the banner, headers, page title, TLS certificate and favicon of every service they reach. An attacker can filter that index by product and version in seconds.
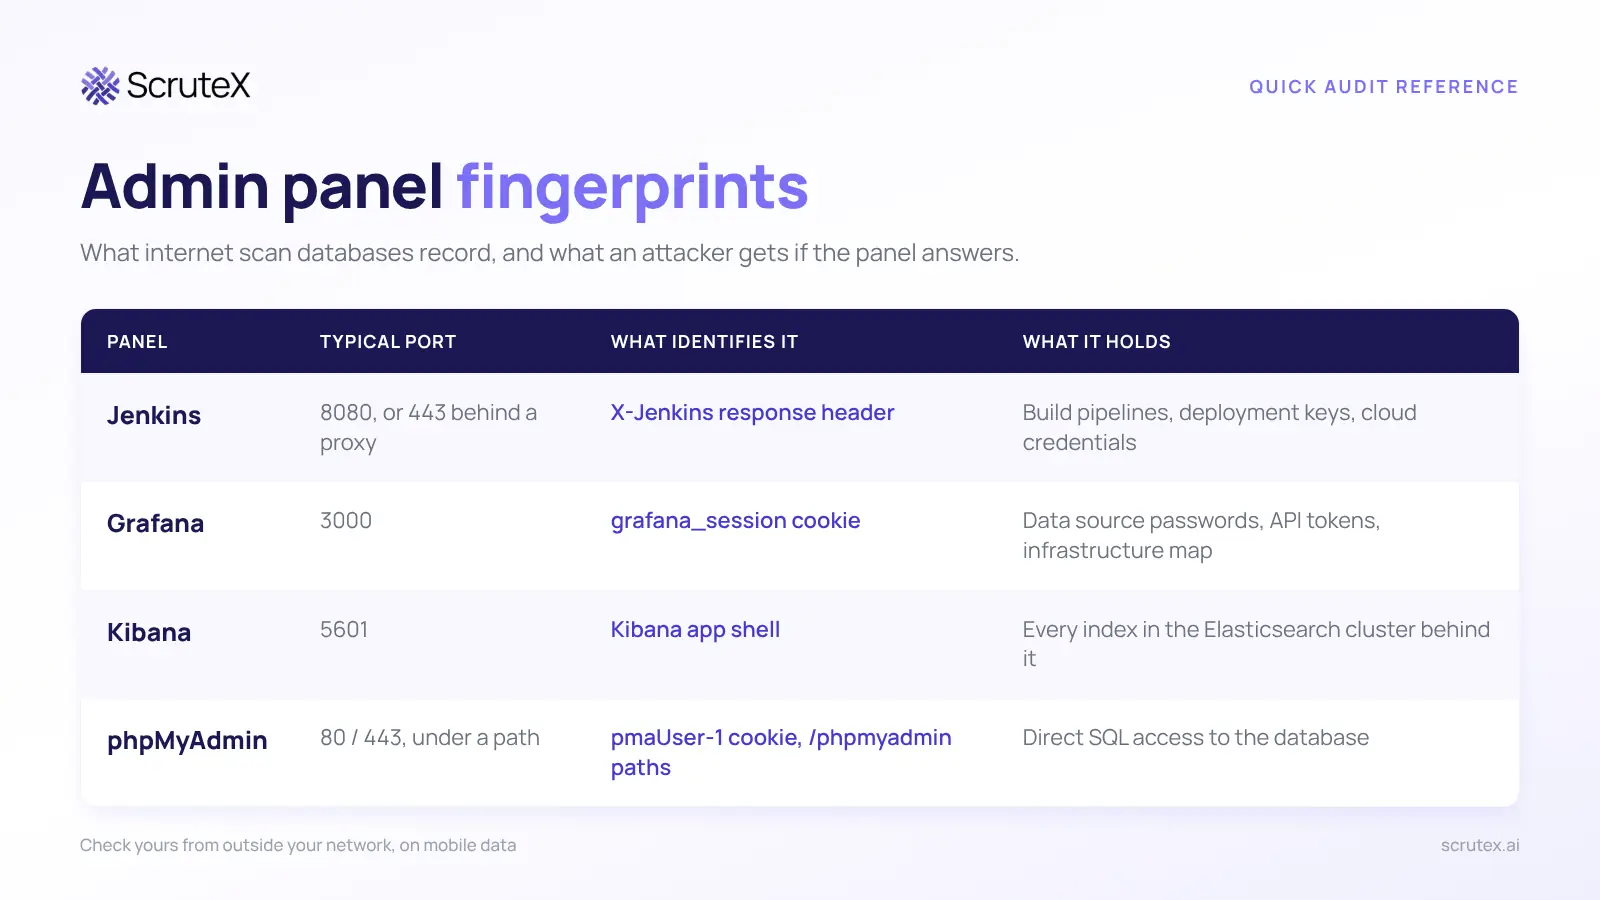
Each panel leaves a recognisable fingerprint. phpMyAdmin sets a pmaUser-1 cookie, Grafana sets a grafana_session cookie, and Jenkins returns an X-Jenkins response header carrying its version number. Those fingerprints are what make mass discovery cheap.
Three more discovery routes fill the gaps the search engines miss.
Path guessing. Bots request lists of common admin paths on every web server they meet (ATT&CK T1595.003, Wordlist Scanning). The SANS Internet Storm Center recorded scans that tried dozens of phpMyAdmin path variations, from /phpmyadmin/ and /pma/ to /admin/db/ and /mysql/admin/. Moving a panel to an unusual path slows down a lazy bot. It does not stop a determined one.
Certificate transparency logs. Every public TLS certificate you issue lands in a public log. A certificate for grafana.example.com or jenkins-prod.example.com tells an attacker the hostname before any scanner has visited it (T1596.003).
DNS and subdomain enumeration. Brute-forcing common subdomain names (build, ci, kibana, monitor, dash) against your domain turns up panels that sit behind a hostname but nowhere in your inventory.
Attackers also keep scanning for old bugs long after the patch. On 28 September 2025, GreyNoise saw 110 unique IPs attempt to exploit a Grafana path traversal flaw (CVE-2021-43798) in a single day, and it classified all 110 as malicious. That flaw was almost four years old at the time.
Why is an exposed Jenkins server the worst case?
Jenkins sits in the middle of your software supply chain. It pulls source code, holds the credentials needed to deploy it, and runs commands on build agents. Take over the controller and you take over everything it can touch. That is why Jenkins security comes down to one question first: who can reach the controller?
The script console makes the risk concrete. The Jenkins documentation states that the Groovy script console can run arbitrary scripts in the controller runtime or on agents, create sub-processes, execute arbitrary commands and read any file the controller can access. The maintainers also warn that it can decrypt credentials stored in Jenkins and reconfigure security settings. If that console is reachable without strong authentication, an attacker has remote code execution by design, with no exploit needed. Trend Micro researchers documented attackers abusing misconfigured Jenkins script consoles to deploy cryptocurrency miners in 2024.
The C-Edge case: one Jenkins server, hundreds of banks
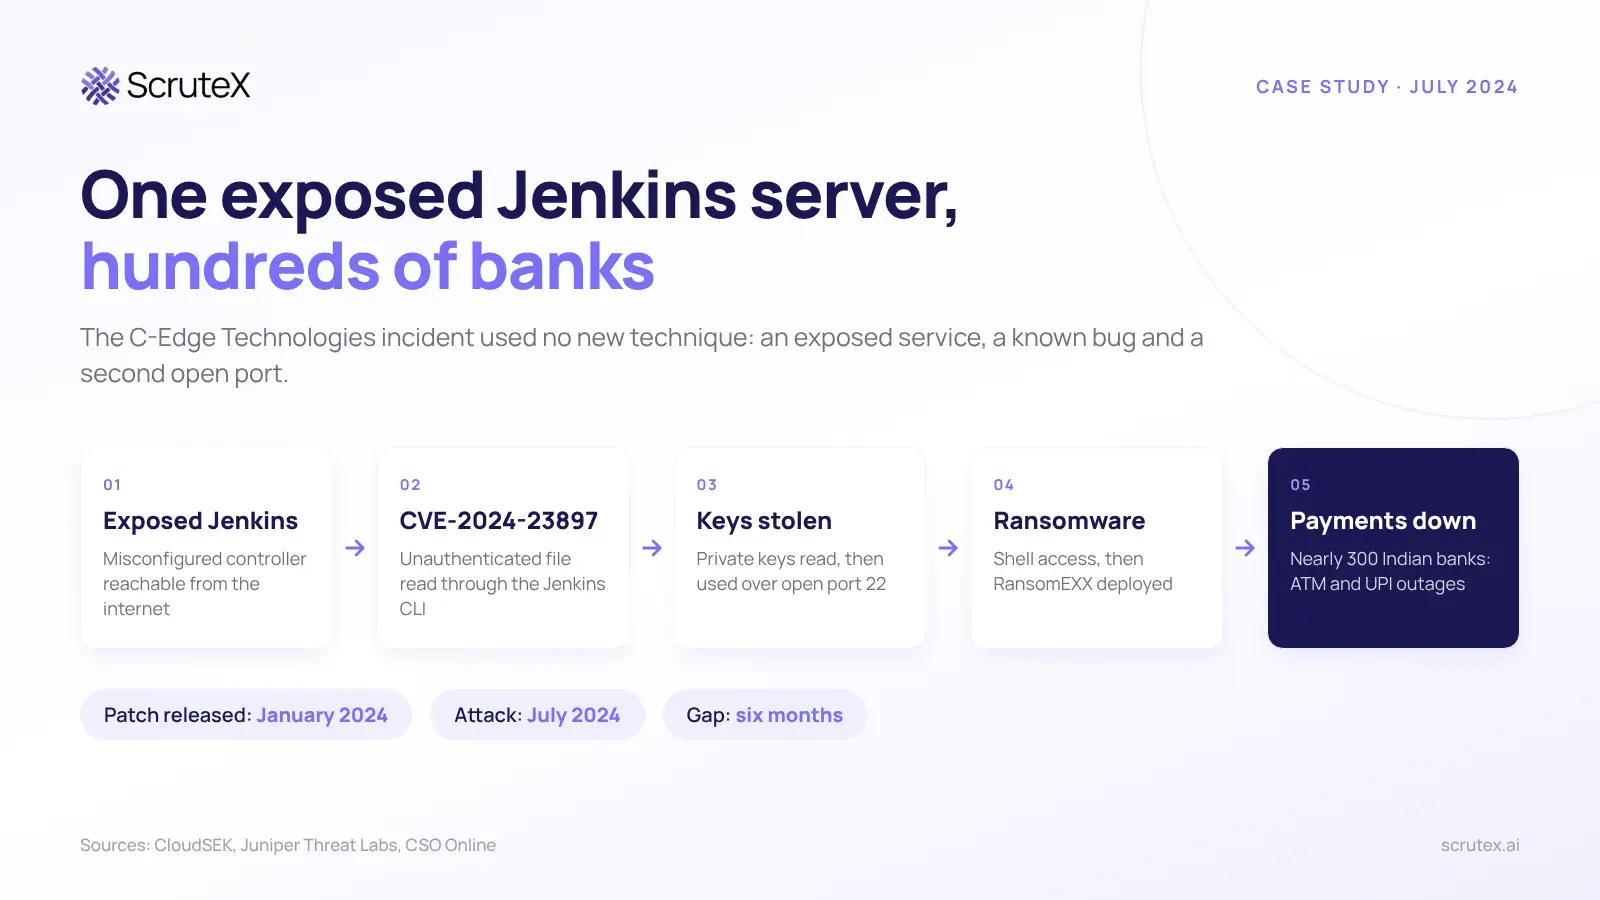
The best-documented example comes from India. Brontoo Technology Solutions, a partner of C-Edge Technologies, reported to CERT-In that the attack started from a misconfigured Jenkins server, and that the attacker used CVE-2024-23897 for initial access. CVE-2024-23897 is a CLI flaw that lets unauthenticated attackers read files on the controller. CloudSEK found that because port 22 was also open, the attacker read private keys through the bug and used them to get shell access. CloudSEK and Juniper Threat Labs linked the intrusion to the RansomEXX group. Payment systems at nearly 300 small Indian banks went down, and customers could not withdraw cash at ATMs or use UPI.
That chain used no new technique: an exposed service, a known bug and a second exposed port. Jenkins had shipped the fix six months before the attack, in January 2024. Shortly after disclosure, Shadowserver counted nearly 45,000 internet-exposed Jenkins servers still running vulnerable versions.
Jenkins in 2026
The pressure has not eased. Jenkins disclosed CVE-2026-53435, an insecure deserialisation flaw in how Jenkins handles config.xml submissions, on 10 June 2026. VulnCheck added it to its known exploited list on 15 June, and a public proof of concept exists. The attacker needs low-level permissions (Overall/Read plus View/Configure or Item/Configure). It affects weekly releases up to 2.567 and LTS up to 2.555.2, and the fixes are 2.568 and LTS 2.555.3. Low-permission bugs matter here because many teams give broad read access to "everyone logged in", and some leave anonymous read on.
Then on 28 October 2026, the Jenkins project fixed 15 vulnerabilities in core. They include an XStream deserialisation flaw (CVE-2026-117612) that gives a low-privilege user remote code execution on the controller, plus file read, file write and stored XSS issues. One stands out for internet-facing servers. CVE-2026-117618 needs no authentication at all: an attacker who wins a race during the setup wizard can create an administrator account. Its CVSS 3.1 vector scores 8.1. The vulnerable endpoint only exists while the controller has no user accounts, so the exposed case is a brand-new controller that someone puts online before finishing setup. Fixes are in Jenkins 2.588 and LTS 2.580.2. The Jenkins advisory does not report any of the 15 as exploited. Based on the June timeline, where exploitation followed disclosure within five days, that can change fast.
What does an exposed Grafana instance give away?
Grafana looks harmless because it draws charts. The risk sits behind the charts. Grafana stores none of the metrics, logs or traces it shows. It queries external data sources each time a dashboard renders, and to do that it stores credentials for Prometheus, Loki, SQL databases, cloud monitoring APIs and more. An attacker who gets into Grafana gets that credential set and a labelled map of your infrastructure, with hostnames and service names already annotated by your own engineers.
The best-known path to those credentials is CVE-2021-43798, a pre-authentication file read that affects Grafana 8.0.0-beta1 through 8.3.0. CISA added it to the Known Exploited Vulnerabilities catalog in October 2025. Attackers manipulate the plugin path in the URL to read files outside the intended directories. Public tooling goes further: one exploit repository automates reading the Grafana database and decrypting data source passwords using the secret key from grafana.ini. That turns a file read bug into stolen production database passwords.
Grafana patching lags badly. When OX Security researchers examined CVE-2025-4123, an account takeover bug they named "Grafana Ghost", they found 128,864 Grafana instances exposed online, with 46,506 still on vulnerable versions, about 36%.
Default credentials remain a problem too. Grafana's out-of-the-box login is admin/admin, and a user can skip the prompt to change it. Anonymous access, when someone turns it on for a wall-mounted dashboard and forgets about it, is just as bad.
What can an attacker do with an open Kibana?
Kibana is the front end for Elasticsearch, and that's what makes an open instance so damaging. An exposed Kibana on its default port 5601 gives an attacker a graphical interface to browse every index, run queries and download data, with no command-line skill needed. Kibana also adds its own login to defend. Strong Elasticsearch authentication does not help if the Kibana account in front of it has a weak or reused password.
The scale of past Kibana leaks shows why this matters to ordinary people as well as companies. In 2022, more than a billion personal records stolen from Shanghai police systems turned up for sale. LeakIX traced the exposure to a Kibana dashboard on port 5601 with no password, open since the end of 2020. The records included names, addresses, national ID numbers and phone numbers. In a smaller case, UpGuard found a Kibana front end that allowed access without authentication, with dashboards labelled as production data, exposing debt collection records on thousands of borrowers.
Patched, authenticated Kibana is not automatically safe either. In March 2025, Elastic fixed CVE-2025-25012, rated 9.9. The prototype pollution flaw allowed code execution through a crafted file upload and crafted HTTP requests. In Kibana 8.15.0 up to 8.17.1, a user with only the Viewer role could exploit it. Read-only access to Kibana could become code execution on the server. The fix is Kibana 8.17.3, or setting xpack.integration_assistant.enabled to false where an upgrade isn't possible yet.
Why is phpMyAdmin still a target?
phpMyAdmin is old, familiar and still everywhere, especially on shared hosting, legacy PHP stacks and developer machines with public IPs. It hands whoever logs in a full SQL client in the browser. Depending on the database user's privileges, that can mean reading every table, creating new users or writing files to the web server.
The main threat is credential attacks at scale. The SANS Internet Storm Center has noted that phpMyAdmin has no built-in protection against brute-force attempts, even with its login page in front. Botnets automate the rest. Intezer documented Muhstik variants that scan IP blocks, brute force phpMyAdmin logins and report vulnerable servers back to the operators. Databases with weak passwords, root logins over the web or credentials reused from a breached account fall quickly.
The attack chain from discovery to impact
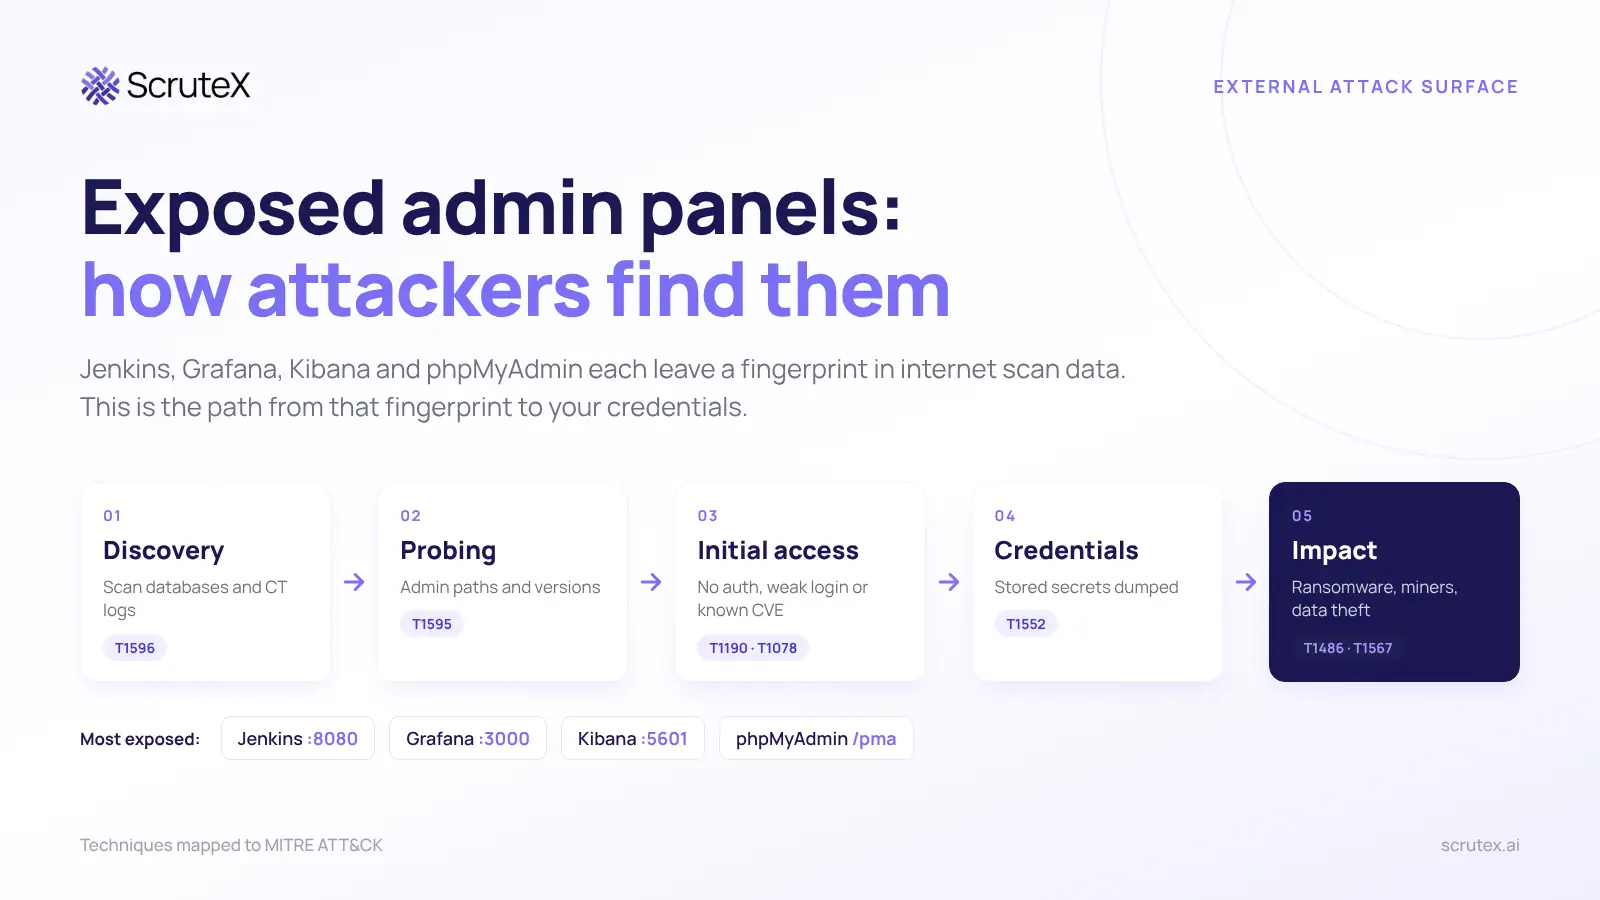
All four panels follow the same pattern. Mapping it to MITRE ATT&CK shows defenders where each control breaks the chain.
| Stage | What the attacker does | ATT&CK technique | Where you can break it |
|---|---|---|---|
| Discovery | Searches internet scan databases and CT logs for panel fingerprints | T1596.005, T1596.003 | Remove public exposure; avoid descriptive hostnames for admin tools |
| Probing | Guesses admin paths, checks versions | T1595.002, T1595.003 | Restrict by IP or identity-aware proxy |
| Initial access | Uses an unauthenticated panel, a default or leaked password, or a known CVE | T1190, T1078 | Patch KEV-listed versions first; enforce SSO and MFA |
| Credential access | Dumps stored secrets: Jenkins credentials, Grafana data sources | T1552 | Use short-lived credentials; rotate after any exposure |
| Execution and impact | Runs scripts, deploys miners or ransomware, exfiltrates data | T1059, T1486, T1567 | Monitor the panel's own audit logs; segment build and data systems |
The second row is where most organisations can act fastest. A panel that only answers your VPN range or your identity provider is invisible to the first two stages, and that is where nearly all opportunistic attacks start.
How do you find your own exposed admin panels?
The method below works with free tools. The hard part is coverage: your list is only as good as your knowledge of what you own.
- Build the asset list from outside in. Start with every domain your organisation registers, then pull subdomains from certificate transparency logs and passive DNS. Add your cloud accounts' public IP ranges. Include acquisitions, regional sites and any agency infrastructure that carries your name. Our guide to finding exposed subdomains covers this step in depth.
- Check what answers on admin ports. Look for services on 3000, 5601, 8080, 8443, 9000 and 9090, as well as 80 and 443. Test from a connection outside your corporate network. A panel that's blocked from the office but open on mobile data is still open.
- Fingerprint what you find. Match headers, cookies and page titles against the table above. Record product and version.
- Test the authentication state. From an external connection, check whether each dashboard loads without logging in. For Jenkins, check whether anonymous users can read jobs. For Grafana, check whether anonymous auth is on.
- Compare versions against the KEV lists. Check CISA KEV and VulnCheck KEV for each product and version you found. Use both: CVE-2026-53435 appeared on VulnCheck's list within five days of disclosure, and CISA had not listed it when we checked.
- Search breach and stealer log data for the panel's users. A password-protected Grafana is still exposed if an engineer's credentials sit in a stealer log.
Then fix in this order:
| Priority | Condition | Response time |
|---|---|---|
| 1 | Panel open without authentication | Same day. Treat as an incident and assume stored secrets are compromised |
| 2 | Default or leaked credentials work | Same day |
| 3 | Version matches a KEV-listed CVE | Within 24 to 72 hours |
| 4 | Authenticated, patched, but public | Move behind VPN or identity-aware proxy within the next sprint |
You can do most of this with Shodan or Censys, an open-source scanner such as Nuclei, and a spreadsheet. A one-off sweep is a reasonable start for a small estate. It breaks down in two places: assets nobody listed, and frequency. A new Jenkins agent or a forgotten test Grafana can go live any afternoon, and scan databases will index it long before your next quarterly review.
How do you lock each panel down?
The control that matters most is the same for all four: take them off the public internet. Put each one behind a VPN, a zero-trust or identity-aware proxy, or an IP allowlist. Everything below is defence in depth for when that layer fails.
Jenkins
- Upgrade to 2.588 or LTS 2.580.2 or later. That closes the October 2026 advisory, CVE-2026-53435 and CVE-2024-23897.
- Use matrix or role-based authorisation. Remove anonymous read and turn off user self-signup.
- Limit script console access to a small named admin group, and alert on requests to /script and /scriptText.
- Finish the setup wizard before a new controller is reachable from any network you don't control.
- If the controller was ever exposed, rotate every credential it stores, including cloud keys, SSH keys and repository tokens.
Grafana
- Upgrade to a current release and confirm that no instance still runs a version affected by CVE-2021-43798.
- Change or disable the default admin account. Turn off anonymous auth unless a dashboard truly needs it, and give that dashboard a separate instance with no sensitive data sources.
- Give each data source a read-only database user with the narrowest scope that works.
- If an instance was exposed on a vulnerable version, rotate the secret key and every data source password.
Kibana
- Turn on Elasticsearch security features so every request needs authentication.
- Bind Kibana and Elasticsearch to private interfaces, not every address.
- Upgrade to 8.17.3 or later, or disable the integration assistant until you can.
- Review role assignments. CVE-2025-25012 showed that "read-only" roles can carry more risk than the name suggests.
phpMyAdmin
- Remove it from production servers where possible. Most teams can use a local SQL client over an SSH tunnel.
- Where it must stay, restrict by IP, add HTTP authentication in front, and block root logins with $cfg['Servers'][$i]['AllowRoot'] = false.
- Keep $cfg['AllowArbitraryServer'] set to false so the login page cannot connect to any database server an attacker names.
- Use strong, unique database passwords, and check them against breach data.
Key takeaways
- Attackers find admin panels through internet scan databases, certificate logs and path guessing, not by scanning you directly. Exposure equals discovery.
- Jenkins is the highest-impact panel because it holds deployment credentials and runs code by design. The C-Edge incident in India showed how one exposed server can disrupt payments across hundreds of banks.
- Grafana and Kibana leak credentials and data even when the dashboards look harmless. Old bugs such as CVE-2021-43798 still draw coordinated exploitation waves.
- phpMyAdmin falls to credential attacks at botnet scale because it has no built-in brute-force protection.
- Fix unauthenticated panels and working default credentials the same day, then KEV-listed versions, then move every remaining panel behind identity-based access.
Am I exposed?
Check these yourself today. Each one takes minutes.
- ☐ From a phone on mobile data, try opening your Jenkins, Grafana and Kibana URLs. If a login page appears, they're exposed.
- ☐ In Jenkins, open Manage Jenkins > Security and confirm anonymous users have no read permission and self-signup is off.
- ☐ Check your Jenkins version. If it's below 2.588 (weekly) or 2.580.2 (LTS), you're missing the 28 October 2026 fixes.
- ☐ In Grafana, confirm the admin account no longer uses the default password and that anonymous auth is off.
- ☐ Search certificate transparency logs (crt.sh is free) for your domains, and look for hostnames containing jenkins, ci, grafana, kibana, pma or phpmyadmin. Every hit is a hostname attackers already know.
What ScruteX finds here
ScruteX scans your external attack surface continuously and identifies the product and version behind each internet-facing service, including hosts that aren't in your inventory. When a Jenkins, Grafana or Kibana version matches a known exploited vulnerability, the Exploit Context Layer adds weaponisation status and active campaign intelligence, so an exposed panel on a KEV-listed version ranks above a patched one. Data Exposure Insights matches leaked credentials and stealer log entries tied to your domains, which shows when a password-protected panel isn't as protected as it looks. Within a scope you define, automated pen testing can confirm whether an exposure is exploitable before your team escalates it, and a person on your side approves the test plan before it runs.
ScruteX sees only what is reachable from the internet. A panel exposed only inside your network, or properly behind a VPN, won't appear, and that is the correct result.
What that looks like
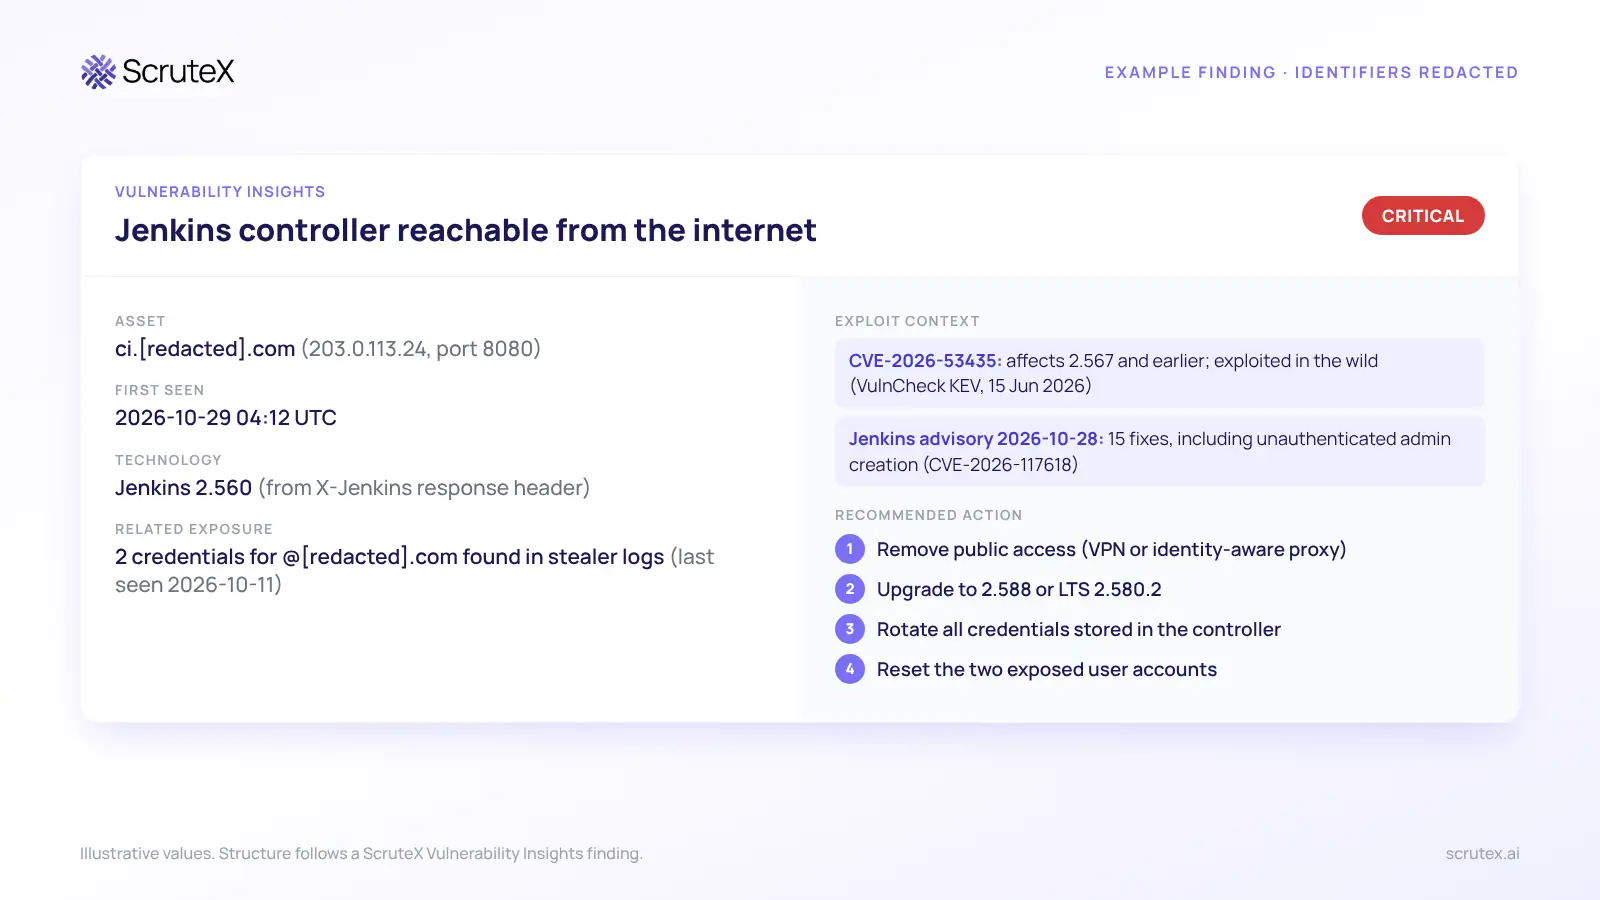
An example finding, with identifiers redacted. The structure follows a ScruteX Vulnerability Insights finding. The values are illustrative.
Which of your admin panels answer from the internet?
Add your domain and ScruteX starts mapping what attackers can see: internet-facing services, their versions, and which ones sit on known exploited bugs. Domain only. No agent, no credit card.
Where to go next
- If you don't know every host you own: Vulnerability Insights, which runs the continuous discovery and version fingerprinting described above across domains you may not have listed.
- If a panel is password-protected and you want to know whether that holds: Data Exposure Insights, which checks stealer logs and breach data for the accounts that log into it.
- If you've closed the panels and want the next layer: Exposed Swagger Files, APIs and Staging Sites: What Attackers Find First covers the admin-adjacent exposure teams forget.
- If your panels sit on subdomains nobody tracks: How to Find Your Exposed Subdomains Before Attackers Do goes deeper on the discovery step.
FAQ
Q: What is an exposed admin panel?
A: An exposed admin panel is a management interface, such as Jenkins, Grafana, Kibana or phpMyAdmin, that responds to requests from anyone on the internet instead of only trusted networks or users. Attackers find these panels through internet scan databases and then try default credentials, leaked passwords or known vulnerabilities.
Q: How do hackers find exposed Jenkins servers?
A: They search internet-wide scan databases such as Shodan and Censys for Jenkins fingerprints, including the X-Jenkins response header and the login page title. They also check certificate transparency logs for hostnames like jenkins or ci, and they filter results for versions affected by known exploited CVEs.
Q: Is it safe to expose Grafana if it has a password?
A: No. A public login page still exposes you to pre-authentication bugs, credential stuffing with leaked passwords and default credentials. Grafana stores the passwords for every data source it queries, so put it behind a VPN or identity-aware proxy and use read-only data source accounts.
Q: What is the Jenkins script console and why is it dangerous?
A: The script console at /script runs Groovy code on the Jenkins controller and its agents. It can execute system commands, read files and decrypt stored credentials. Anyone who reaches it with admin rights controls the build system, so restrict it to a small admin group and keep Jenkins off the public internet.
Q: What should I do if I find an exposed admin panel?
A: Remove public access first. Then upgrade to a patched version and review logs for unknown logins or script execution. Rotate every credential the panel stores or can reach. If it was open without authentication, treat it as a potential compromise and investigate the systems it connects to.